Grocery Item Search Suggestions

Existing customers frequently use the search bar to add items to the cart.  Customers will typically search for items, add the item to the cart, then search again for the next item.  Google Analytics doesn’t do a very good job of depicting this flow in analysis, so you have to dig deeper into the data to understand the flow.

Google has an analytics feature that allows you to see the “Search Refinement” within your site.  Normally, this suggests that the customer uses a search term, doesn’t find what they want, and refines the search.  But on grocery sites where customers are repeatedly searching and adding items to a cart, the next search is less of a refinement and more of a next item search.  When the site employs various dynamic HTML features that allows the user to add an item to the cart without reposting the page, the analytics tracking doesn’t realize its a second item search.

To analyze this behavior, we used Content Square and triggered an artificial page view to see when customers searched and then added an item to the cart.  We saw that about 15% of the time, the user was refining the search and the other 85% the search was for the next item.  See the chart below:

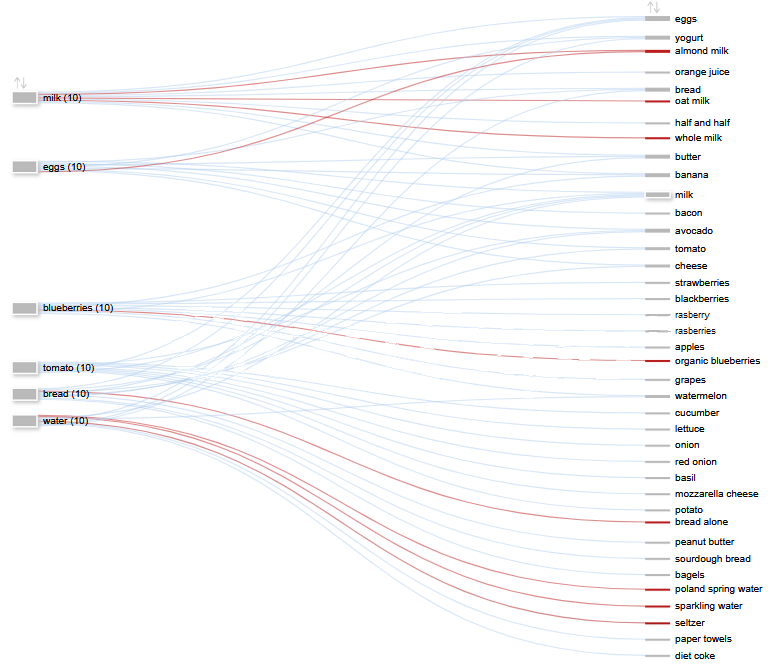
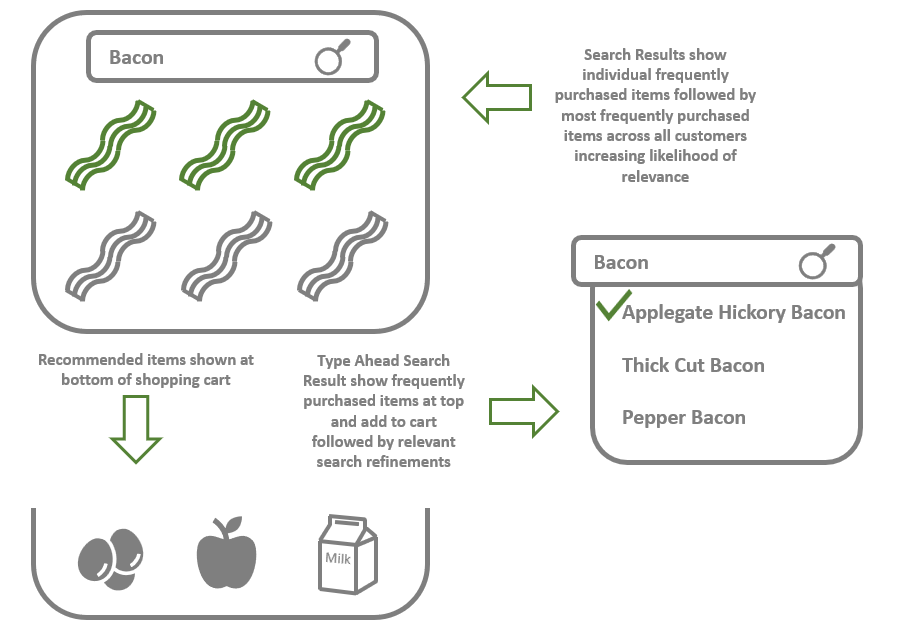
Here you can see a handful of searches in red are refinements and most are related searches in blue.  For example the most popular searches after eggs are milk, bread, and bacon.  The most popular searches after blueberries are other assorted fruits.

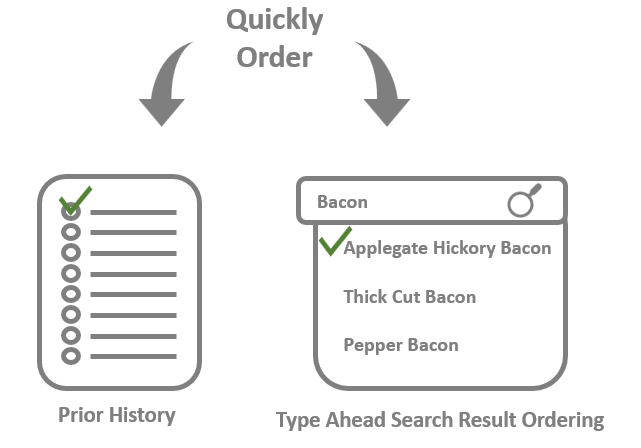
With this knowledge, a site can use algorithms to suggest the next item search.  A good way of displaying that would be under the search bar with easy to click search terms for the next item.  This would make the customer’s experience more efficient and would have the added benefit of suggesting additional items that the customer may have forgotten.

Now, why is the customer doing this flow?  What are they trying to achieve?  Typically, the customer will have a shopping list that they wrote down throughout the week and are then trying to add all those items to the cart.  A more efficient way to do this might be to allow the customer to type all the items they are looking for at once and then cycle through each one.

K3Group can help you analyze your flow to make the customer’s shopping experience more efficient which leads to better customer satisfaction. Please see the other blog entries for more analysis of the online grocery shopping flow.

Dynamic Assortments in Online Grocery Shopping

Assortments are fixed in a grocery store.  You understand the demographics of the customers and tailor the assortment to the averages for the store, but once it’s done it’s fixed for all customers that visit that store.  Online that’s not the case and you can customize assortments to what customers are most likely to buy or what you want to promote. Customized assortments are also a way for vendors to most effectively spend their ad dollars because customers see their products when it’s relevant.  It’s better for the customer, better for you as the grocer, and better for the vendors pushing their products.

We used a tool called Bloomreach to customize the search results in different ways:

  • Dynamic Search Results:  Through Bloomreach, you can send search requests to the engine and your own catalog which then returns a dynamic list of what the customer is most likely to buy.  We added the most frequently purchased items to the top of search results to fully customize the results.
  • Type Ahead Search:  With type ahead search, you’re limited to at most 10 to 15 keywords.  We experimented with using the top 3 most frequently purchased items followed by promoted or relevant keywords.
  • Recommendations: Based on search history and purchase history, Bloomreach would recommend items that were relevant to the customer.

The old way of presenting items to customers through a standard catalog taxonomy is dead.  We used to joke that we didn’t need a website anymore.  All we really needed was a search bar because 80% of the time customers would simply go to the search and bypass everything else on the site.  So props to Google for simply showing a search bar when you go to their site.

Now, we can’t really do that because it would drive the merchandisers crazy!  They still cling to the belief that beautiful images sell products.  And they are partially right, but how many beautiful images are needed?  With heatmap functionality, we could see as you traverse the page, purchases fall off fast.  What customers can see on the page under the search bar is viewed 100% of the time, but then drops off quickly on the next scrollable section until it’s almost non-existent further down the page.

Notice I said purchases, not views.  When we studied behavior, it was obvious we had two distinct audiences: new customers and existing customers.  New customers wanted to browse, but they didn’t purchase as frequently or as much and existing customers wanted efficiency.  Satisfying both of these competing needs was a challenge.

When you get to know the customer through their purchase history, you can provide a much better experience with more relevant products.  But you can also use aggregate history across all customers to recommend products which is what you do with new customers.  We tested multiple ways of changing the assortment with Bloomreach ultimately ending up with search results that improved conversion rates.  We also used a tool called Criteo to intersperse relevant sponsored items throughout the search results for additional ad revenue.

K3Group can help you improve your customer experience with similar techniques leading to an increased order value and improved conversion rates.

Building a Grocery Cart Faster

Building the ideal shopping experience for existing customers is extremely important because they drive the most profit.  At one client, existing customers were only 20% of the sessions but drove 80% of the profit which is common for many retailers.  We spent time analyzing the customer flow from initial query through to site exit or purchase with Content Square, Google Analytics, Google Search Console, and transaction data through Microsoft Power BI.  Once we formed a hypothesis, we would create an experiment and test it through Optimizely with A/B testing.  Follow ups were performed using qualitative surveys with Qualtrics to understand what the customer was thinking.  The whole process yielded tremendous insight into their buying behavior.

One of the most insightful charts was the Content Square journey analysis and their heatmaps.  As shown below, you can see the flow of customers where the chart aggregates common URLs for each step in the customer journey.

Through the intuitive interface you can see that existing customers primarily spent time looking at prior order history and the search bar.  What exactly were they doing?  They were building their cart as fast as they could.  As mentioned before, we saw existing customers would spend an average 12 min shopping.  They would add as many items as they could in that 12 min and then would stop the session.  Sometimes they would use multiple sessions and other times they would continue on to purchase.

The customers would start with their frequently bought items from previous carts and then shift to the search / add to cart flow seen above in the purple and orange wedding cake flow.  People are creatures of habit and buy items they have purchased in the past.  So, one of the tests we decided to run was to change the type ahead search to display frequently purchased items based on the key word and then allow the customer to add the item to their cart directly from type ahead results.

By doing this, you would speed up the process of adding items to the cart resulting in a quicker shopping experience.  What’s the downside of this flow? You don’t have as many opportunities to merchandise to the customer and entice them to buy additional items.

In another article we’ll discuss ideas on how to still merchandise to customers and make the flow as efficient as possible. K3Group can help you improve your customer experience with similar techniques leading to an increased order value and improved conversion rates.

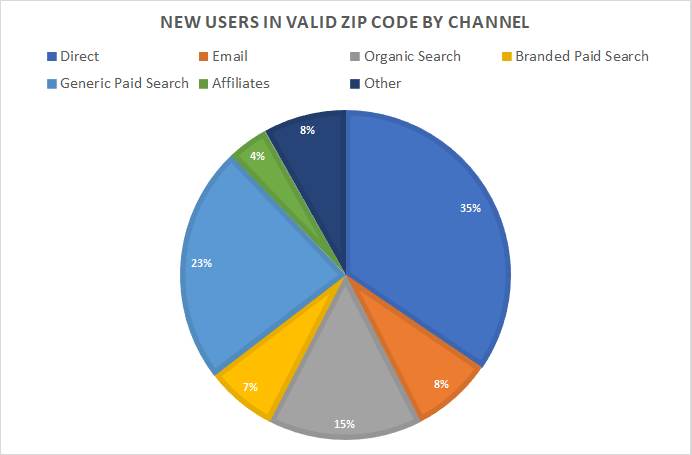
Online Grocery Shopping Channel Analysis

Here are some more insights we found in our analysis of online shopping behavior and tests:

  • Targeted email and direct mail campaigns were most effective.  By analyzing prior purchases, you can for example determine if a customer prefers meat, poultry, fish or vegetarian. By targeting correspondence and promotions at a macro level, the engagement rate was significantly higher than generic promotions for protein.
  • A significant number of customers arrived at the grocer’s site through organic searches.  Many of the organic searches are for broad categories like “fresh fruit online” or “fresh fish”.  This ultimately led to a search link on the site with little to no merchandising, so new customers didn’t understand their value prop.  In one experiment, we prominently displayed value messages in search results which we expected to have a higher conversion rate with new customers.
  • New customers tend to browse the site categories, navigating through headers and surveying the assortment whereas existing customers tend to simply search for the items they want.  This leads to more opportunities to merchandize to new customers but if you try to merchandize too much to existing customers it simply slows the experience down and they buy less.

Building on the previous post analysis, we utilized Google Analytics to understand where the customers were coming from and their conversion rates for each acquisition path.  Using our insight from the previous analysis we again segmented the customers into existing users and new users from valid zip codes.

Here you can see that the majority of customers were arriving at the site direct.  For existing customers, the users would go directly to the URL or click on a link in their history such as the cart page.  A significant number of customers arrived from Organic Search.  Again, a significant number of existing customers would simply use Google search to find the site rather than clicking on their browser history.  A significant number of new users would also enter the retailers name in search and we suspected that the brand awareness came from marketing activity such as billboards, direct mail, and other advertising.

ChannelTypeUsers (K)Bounce RateConversion Rate
DirectE41516.12% 24.35%
N58943% 10.75%
EmailE10529.32% 12.13%
N9053.45% 5.27%
Organic SearchE8114.03% 24.34%
N25836.67% 10.68%
Branded Paid SearchE6112.99% 22.58%
N10321.28% 13.85%
Generic Paid SearchE3742.86% 9.98%
N39881.64% 0.89%
AffiliatesE3613.64% 26.83%
N4536.20%12.93%
Existing and New Users by Channel

The glaring issue in this analysis was that Generic Paid Search was performing abysmally for new customers but had a significant number of sessions.

Further analysis on the Generic Paid Search found that customers were searching for individual items and would then abandon the site.  Our next step was to survey these customers to try and understand what the customers were looking for.  Using Qualtrics we could solicit the customers for feedback by offering a credit on their next purchase.  By doing that, customers that had no intention of buying would consider buying now that they were invested and had a credit.

K3Group can work with you to fine tune your strategy.  Again, we’ll send more insights in our next cadence and if you’d like to learn more about any of this, we’d be happy to share the information on a call.

Insights on Grocery Online Shopping Behavior

We work with many grocery stores helping with eCommerce optimization, category management, and pricing.  At one customer we analyzed online customer behavior, researched customer segments, and tested hypotheses.  Here are a couple high level insights we found and our analysis associated with the insights:

  • New customers behaved very differently than existing customers.  It’s obvious, but when looking at browsing patterns we saw that new customers want to explore, browse, and engage with the site while existing customers want to make the process as efficient as possible.
  • Existing customers typically spend a set amount of time buying.  We saw in one test that existing customers spent 12 min shopping and added an average 21 items to the cart.  When we made the process more efficient, they still spent 12 min shopping but added 24 items to the cart.

Drilling in further, we used a tool called Content Square to perform the journey analysis.  The tool helps analyze the full customer experience from journey analysis to heat mapping and session recording.  To start the analysis, we looked at the customer journey for all customers.  The image below shows what that view looks like.

Some interesting questions came out of this.  Why are so many customers coming to the home page and then abandoning the site?  Also, what is driving them to the Product Details Page (PDP) and then abandoning the page.

By integrating with Google Analytics, we were able to utilize the segments across both GA and Content Square to support a deeper dive into the customer journey.  By segmenting new customers from valid zip codes, we were able to see a different picture of how those customers behaved.

It became clear that new customers were driving the abandonment rate.  Further analysis showed that the customers were being driven to the site through Generic Paid Search and Organic Search which we’ll dive into further in a subsequent post.  The other important insight in the journey analysis was that customers were frequently drilling down on the categories and section pages to explore the site.  They wanted to be sold to.  We used that information to further refine their experience to more prominently show the value proposition for the retailer when a customer arrived at the site.

Next, when looking at existing customers, a different behavior profile emerged.  As you can see below, the existing customers utilized reorder and search extensively.

Drilling into the existing customer behavior showed they simply wanted to build their cart and order their items.  As mentioned, they would visit the reorder page, place multiple items in the cart off the page and then search for more items from the search bar.  They rarely visited the category pages.  We ran an experiment to make the customer flow more efficient and found that existing customers originally would spend 12 min on the site and buy an average of 21 items.  When we made the process more efficient, those customers bought an average of 24 items.

K3Group can help you improve your customer experience leading to an increased order value and improved conversion rates.  We’ll drill into other insights we learned in subsequent posts.