
Insights on Grocery Online Shopping Behavior
We work with many grocery stores helping with eCommerce optimization, category management, and pricing. At one customer we analyzed online customer behavior, researched customer segments, and tested hypotheses. Here are a couple high level insights we found and our analysis associated with the insights:
- New customers behaved very differently than existing customers. It’s obvious, but when looking at browsing patterns we saw that new customers want to explore, browse, and engage with the site while existing customers want to make the process as efficient as possible.
- Existing customers typically spend a set amount of time buying. We saw in one test that existing customers spent 12 min shopping and added an average 21 items to the cart. When we made the process more efficient, they still spent 12 min shopping but added 24 items to the cart.
Drilling in further, we used a tool called Content Square to perform the journey analysis. The tool helps analyze the full customer experience from journey analysis to heat mapping and session recording. To start the analysis, we looked at the customer journey for all customers. The image below shows what that view looks like.
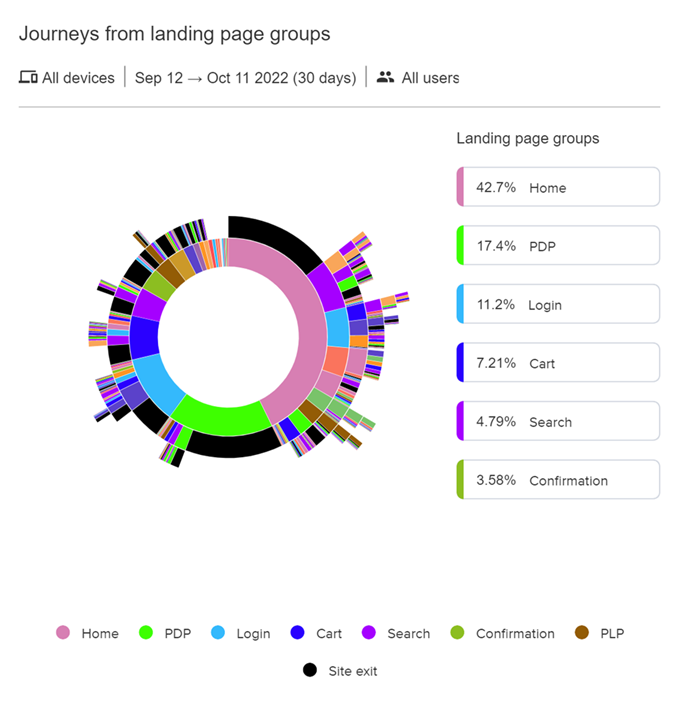
Some interesting questions came out of this. Why are so many customers coming to the home page and then abandoning the site? Also, what is driving them to the Product Details Page (PDP) and then abandoning the page.
By integrating with Google Analytics, we were able to utilize the segments across both GA and Content Square to support a deeper dive into the customer journey. By segmenting new customers from valid zip codes, we were able to see a different picture of how those customers behaved.
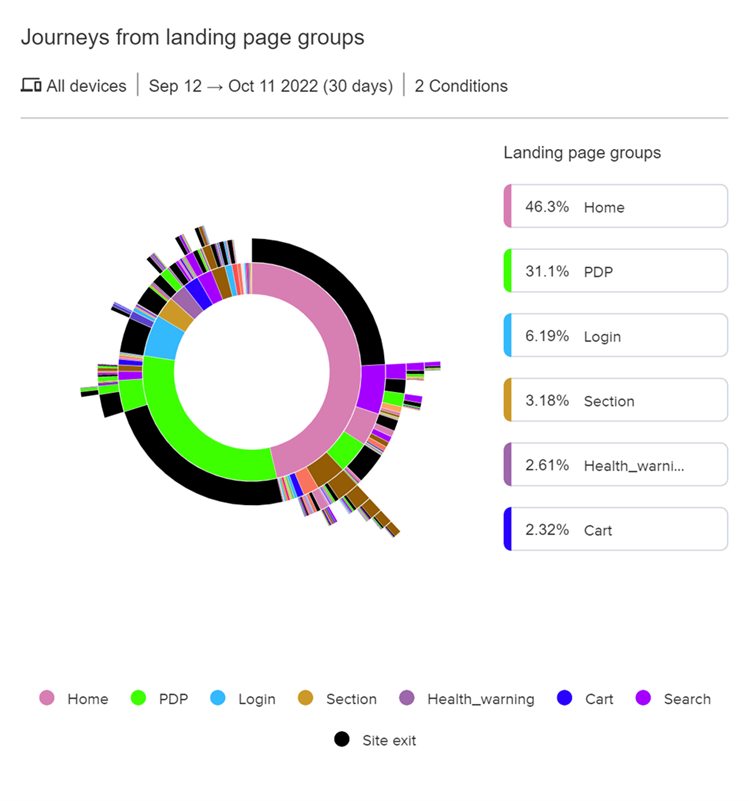
It became clear that new customers were driving the abandonment rate. Further analysis showed that the customers were being driven to the site through Generic Paid Search and Organic Search which we’ll dive into further in a subsequent post. The other important insight in the journey analysis was that customers were frequently drilling down on the categories and section pages to explore the site. They wanted to be sold to. We used that information to further refine their experience to more prominently show the value proposition for the retailer when a customer arrived at the site.
Next, when looking at existing customers, a different behavior profile emerged. As you can see below, the existing customers utilized reorder and search extensively.
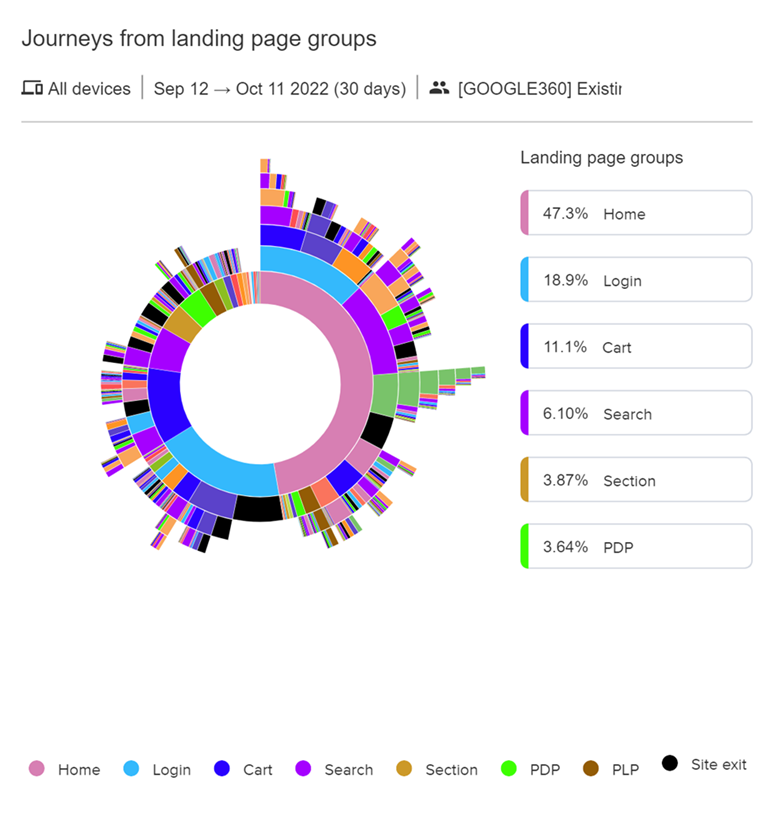
Drilling into the existing customer behavior showed they simply wanted to build their cart and order their items. As mentioned, they would visit the reorder page, place multiple items in the cart off the page and then search for more items from the search bar. They rarely visited the category pages. We ran an experiment to make the customer flow more efficient and found that existing customers originally would spend 12 min on the site and buy an average of 21 items. When we made the process more efficient, those customers bought an average of 24 items.
K3Group can help you improve your customer experience leading to an increased order value and improved conversion rates. We’ll drill into other insights we learned in subsequent posts.