Private equity analytics: two common, high-value use cases
PE teams need numbers that are consistent across systems, comparable across companies, and traceable to transactions. Two situations come up repeatedly and benefit from the same architectural patterns.
Use case 1: One portco, many systems, one cohesive report
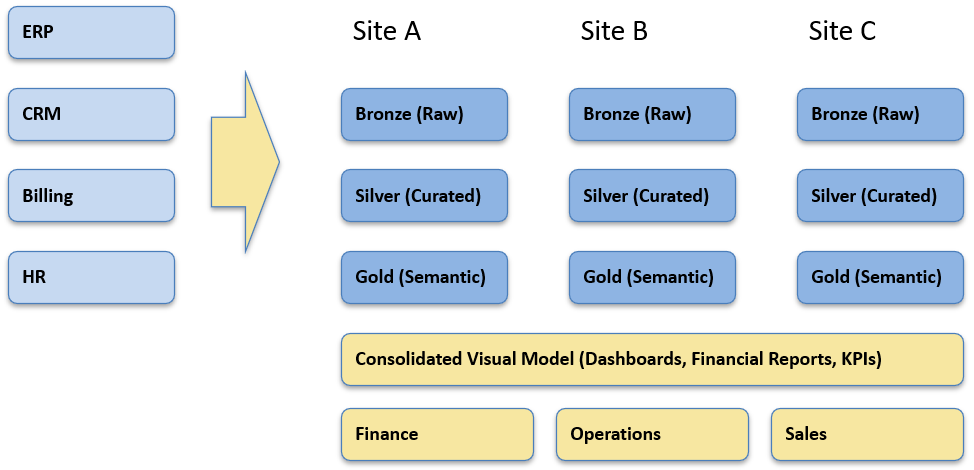
Situation. A mid-market company runs multiple ERPs and adjacent tools including billing, HR, CRM, and eCommerce. Month end close is slow, product/customer/job margin is unclear, and every board request becomes a bespoke spreadsheet that takes time from skilled people to produce and validate.
Design choices. Keep each source/location in its own site model (Bronze/Silver) and expose a normalized view in a governed Gold semantic layer. This avoids a brittle, one-time “merge” and lets each dataset evolve independently. GL accounts map to Income Statement/Balance Sheet through an auditable report-line mapping that’s reused in both transforms and rollups. Deterministic, namespaced surrogate keys prevent ID collisions across systems. Reconciliation is part of the product where invoice-level revenue and COGS tie to GL totals, with a variance registry capturing timing and reclass explanations.
What changes for the business. Finance works from IS/BS/Cash that drill to transactions and tie back to the ledger. Unit economics can be examined by product, customer, or job using driver-based allocations with sensitivity checks. Working capital and AR aging are reported consistently across the portco giving insight into cashflow analysis and working capital. Self-service BI through Power BI or Tableau sits on a semantic model that reflects the finance manual, with row-level security and visible “data as of” status.
Use case 2: Portfolio-wide visibility through normalized revenue & cost categories
Situation. The sponsor needs a consolidated view across companies with different ERPs and charts of accounts. Today, general ledger reporting categories such as revenue and cost is labeled specifically for that company’s needs and is inconsistent with the other portcos in the portfolio. This limits operators and partners from getting comparable views of company health that quickly diagnose successes or problems.
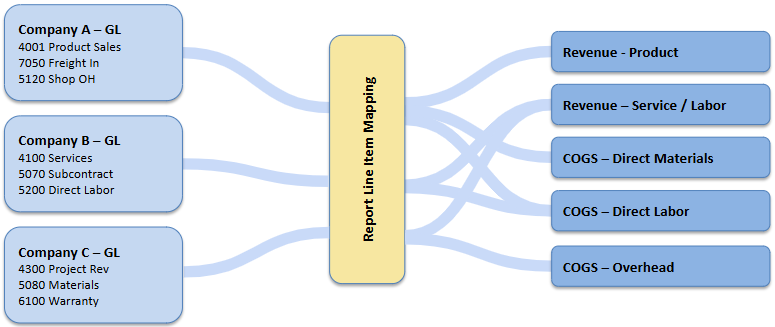
Design choices. Standardize the definitions, not the systems. We implement an effective-dated report-line mapping that assigns each company’s GL accounts to a common Income Statement structure. Two focal points:
- Sales/Revenue categories. Normalize to a shared set (e.g., Product Revenue, Service/Labor Revenue, Project Revenue, Freight/Handling, Discounts & Rebates, Other Income). Where possible, introduce common Sales Categories as reporting line items in the GL to group operationally similar sales items.
- Cost categories. Normalize COGS into consistent buckets (e.g., Direct Materials, Direct Labor, Subcontract/Outside Services, Freight In/Out, Manufacturing/Shop Overhead, Warranty/Returns) and OpEx into standard lines (e.g., Sales & Marketing, G&A, Operations, Technology). If unit economics are in scope, define allocation rules (e.g., shop overhead to jobs, cloud or distribution costs to products) but keep them versioned and reversible.
Each company retains its own facts/dims and refresh cycle (site models in Bronze/Silver). Portfolio views union those stars in Gold with a Company/Location slicer and a consistent fiscal calendar and FX policy (source, rate type, and timing). Exceptions (e.g., unique revenue treatments, local GAAP nuances) are handled via override mappings with rationale and dates, not ad-hoc edits.
What changes for the business. Sponsors and operators can compare consistent margin and expense structures across entities: revenue by normalized category, gross margin by product/service, COGS composition, and operating expense profiles—drillable to transactions and tied back to GL totals. Board packages, lender updates, and operational reviews draw from the same definitions. One delayed company doesn’t block the view; it’s shown with freshness status and can be temporarily excluded without breaking the portfolio roll-up.
Platform considerations (people and workload first)
Platform selection follows the operating model and who will support it after go-live. We do not dictate technology decisions, rather understand the situation and recommend the best platform for the situcation:
- Microsoft-leaning organizations with minimal IT and Power BI usage. A Fabric-centric stack reduces moving parts: capacity-based compute, OneLake storage, data warehouses and a native semantic model.
- SQL-heavy teams needing strong cost isolation and external sharing. Snowflake provides per-team virtual warehouses and straightforward data sharing.
- Engineering-led teams with notebooks/ML and streaming needs. Databricks (Unity Catalog + Delta) fits open formats and Spark-centric workflows.
Any of these can implement the same pattern—Bronze (raw) → Silver (curated) → Gold (semantic)—with idempotent, replayable pipelines, effective-dated mappings, and visible run logs. The right choice is the one your support staff can confidently operate.
Summary
In both use cases, the value comes from consistent definitions, transaction-level traceability, and an operating model that scales across companies without forcing system uniformity. The patterns above provide a practical checklist when scoping similar work.
About K3 Group — Data Analytics
At K3 Group, we turn fragmented operational data into finance-grade analytics your leaders can run the business on every day. We build governed Finance Hubs and resilient pipelines (GL, billing, CRM, product usage, support, web) on platforms like Microsoft Fabric, Snowflake, and Databricks, with clear lineage, controls, and daily refresh. Our solutions include ARR Snowball & cohort retention, LTV/CAC & payback modeling, cost allocation when invoice detail is limited, portfolio and exit-readiness packs for PE, and board-ready reporting in Power BI/Tableau. We connect to the systems you already use (ERP/CPQ/billing/CRM) and operationalize a monthly cadence that ties metrics to owners and actions—so insights translate into durable, repeatable growth.
Explore More on Data & Analytics
- Resilient Data Pipelines for Finance — How to build governed, reliable pipelines (GL, billing, CRM) with controls for daily reporting.
- Private Equity Analytics: Two High-Value Use Cases — Portfolio reporting & exit-readiness analytics that create tangible value during the hold.
- Cost Allocation Without Invoice-Level Detail — Practical methods to apportion costs fairly using GL and operational drivers.
- ARR Snowball: Proving Revenue Durability — Visualize inflows/outflows, improve forecasts, and defend higher exit multiples.
- Extending Snowball to Cash & Inventory — Apply the same flow lens to cash (AR ⇄ AP ⇄ Cash) and inventory to improve CCC, turns, and margin.
- Augmenting Financial Analysis with Agentic AI Workflows — Use agentic AI for close acceleration, probabilistic ARR forecasting with prescriptive actions, and causal variance analysis.