Extending Snowball to Cash & Inventory
Snowball is a general-purpose flow lens, not just a SaaS metric. The same Sankey-style visualization that clarifies ARR—inflows, outflows, and the net build with velocity/acceleration—translates cleanly to other operating flows. For cash, it traces invoices and receivables through collections alongside payables and disbursements to reveal net cash build, DSO/DPO, slippage, and CCC. For inventory, it maps receipts to on-hand (by age), then to WIP, shipments/returns, and scrap, exposing turns, DIO, and leakage. Use the same monthly cadence—scorecard, flow diagnostics, actions with owners—to turn hidden movement into decisions that protect runway and margin.
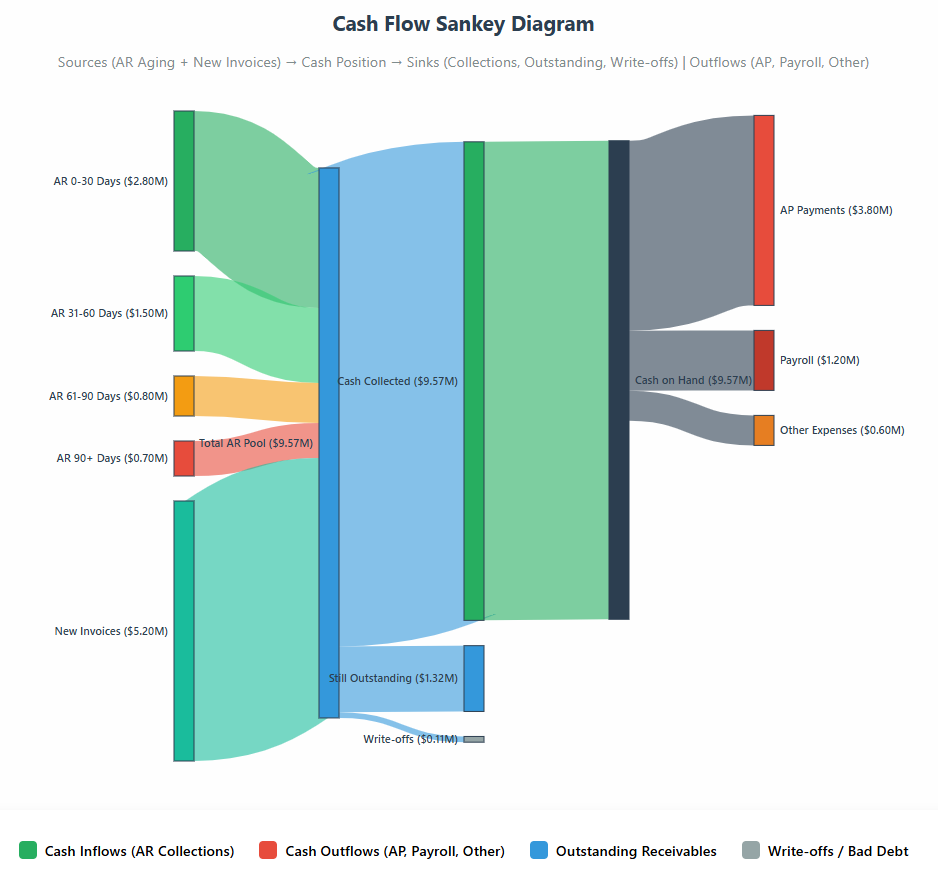
Cash-Flow Snowball (AR ⇄ AP ⇄ Cash)
Turning attention to cash flow, the same Snowball lens maps how dollars enter as invoices (AR), age through buckets, and convert to cash—while in parallel showing how purchases become AP and flow out as disbursements. A Sankey-style view makes sources and sinks obvious at a glance (collections, slippage, write-offs; payroll, vendors, taxes), and a monthly scorecard tracks net cash build, its velocity, and acceleration. The result is an operating picture you can act on: tighten or relax payment terms, target early-pay discounts, adjust payment run cadence, prioritize supplier payments, and focus collections where aging migration signals risk. Pair the flow with DSO/DPO/CCC and a simple Collections Efficiency = Cash Collected ÷ (Opening AR + Invoiced) to turn cash visibility into runway and working-capital gains.
What it is. A flow view of dollars from invoices → receivables → cash collected, and from purchases → payables → cash paid, producing a net cash build curve (and its velocity/acceleration) each month. Use a Sankey to show sources (AR aging buckets, new invoices) and sinks (collections, bad debt) alongside outflows (AP aging, payroll, taxes, capex).
Key inputs. AR ledger (invoice dates, due dates, terms, aging), AP ledger (bills, terms), cashbook, payment runs, pipeline-to-invoice assumptions, and expected payment schedules.
Operating metrics & formulas
- Collections Efficiency (period) =
Cash Collected ÷ (Opening AR + Invoiced) - DSO / DPO / CCC:
DSO = AR ÷ Avg Daily Revenue,DPO = AP ÷ Avg Daily COGS,CCC = DSO + DIO − DPO - Slippage: dollars moving from 0–30 → 31–60 → 61–90 → 90+ buckets (leading risk)
- Expected Collections (next 4/8/13 wks) = Σ(
Invoice × Probability(bucket, score) × (1 − Dispute%)) - Net Cash Build (velocity) =
Ending Cash_t − Ending Cash_{t−1}; Acceleration = ΔVelocity
Operator decisions (examples)
- Tighten terms (shorten from Net45→Net30 where risk is low), early-pay discounts for specific cohorts, or collections playbooks where slippage grows.
- Shift payment runs and renegotiate DPO with low-risk suppliers to compress CCC.
- Prioritize AP by strategic importance (supply-critical vendors first), defer or stage capex.
- Forecast guardrails: hold a minimum cash runway (e.g., ≥ 6× monthly net burn); trigger cost controls if runway breaches.
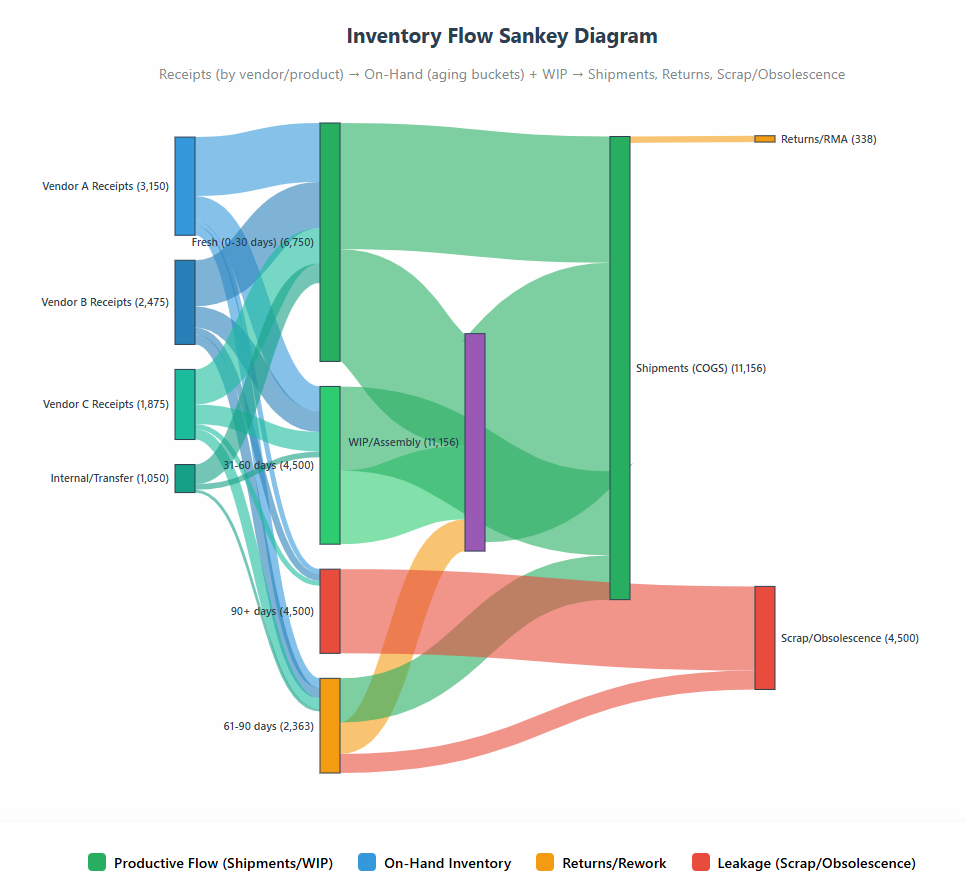
Inventory Snowball (Receipts ⇄ On-Hand ⇄ Consumption/Shipments)
Here’s how the same Snowball lens powers inventory: map receipts into on-hand (by age buckets), through WIP/consumption, and out as shipments/returns/scrap. In a Sankey-style view, link thickness shows volume while color separates productive flow from leakage (shrink, obsolescence). Run it by cohort (receipt vintage), product family, vendor, or location to spot slow movers early, tune ROQ/ROP and safety stock, and align purchasing with real demand. A simple scorecard—net inventory build, throughput velocity, turns/DIO, and leakage—turns visibility into actions like throttling receipts, markdowns, vendor returns, or WIP gating to protect margin and service.
What it is. A flow of units (and dollars) from receipts → on-hand (age buckets) to WIP/consumption → shipments/returns → scrap/obsolescence. Track net inventory build, throughput velocity, and leakage (shrink/obsolete) by cohort (receipt vintage), product family/SKU class, vendor, or location.
Key inputs. Item master, BOM (if applicable), receipts, moves/transfers, WIP, shipments (COGS), returns/RMAs, scrap/obsolescence, forecast, and safety-stock/ROP settings.
Operating metrics & formulas
- Turns =
COGS ÷ Avg Inventory; DIO =(Avg Inventory ÷ COGS) × 365 - Aging distribution (0–30/31–60/61–90/90+) by SKU family or vendor
- Obsolescence Rate =
Scrap + Write-downs ÷ Avg Inventory - Fill Rate / OTIF by cohort; Excess Days Supply =
On-Hand ÷ Avg Daily Demand - Inventory Efficiency (period) =
Productive Flow (WIP + Shipments) ÷ (WIP + Shipments + Scrap/Obsolescence)
Operator decisions (examples)
- Throttle receipts or replan ROQ/ROP where excess days supply is high; expedite only for cohorts with proven demand velocity.
- Markdown/liquidate aging cohorts before they cross obsolescence thresholds; vendor returns where contracts allow.
- Postponement/late-stage assembly to reduce variant risk; vendor rationalization when shrink/defect rates spike.
- Safety-stock tuning by forecast error and service target; WIP gating if flow is blocked downstream.
Conclusion: one lens for flows that drive value
Extending the Snowball lens to cash and inventory gives you a single way to see—and manage—your most important flows: dollars, units, and revenue. The result is earlier signals and fewer surprises: net cash build with DSO/DPO/CCC guardrails, inventory throughput with turns/DIO and leakage, and the same Sankey-style visibility you use for ARR. Run one monthly cadence—scorecard → flow diagnostics → 2–3 actions with owners—and you’ll turn visibility into working-capital gains, margin protection, and a stronger balance sheet. Lock a simple taxonomy, keep definitions stable, and track movement over time. One lens, three flows: compounding revenue, healthier cash, and smarter inventory—operated to value.
About K3 Group — Data Analytics
At K3 Group, we turn fragmented operational data into finance-grade analytics your leaders can run the business on every day. We build governed Finance Hubs and resilient pipelines (GL, billing, CRM, product usage, support, web) on platforms like Microsoft Fabric, Snowflake, and Databricks, with clear lineage, controls, and daily refresh. Our solutions include ARR Snowball & cohort retention, LTV/CAC & payback modeling, cost allocation when invoice detail is limited, portfolio and exit-readiness packs for PE, and board-ready reporting in Power BI/Tableau. We connect to the systems you already use (ERP/CPQ/billing/CRM) and operationalize a monthly cadence that ties metrics to owners and actions—so insights translate into durable, repeatable growth.
Explore More on Data & Analytics
- Resilient Data Pipelines for Finance — How to build governed, reliable pipelines (GL, billing, CRM) with controls for daily reporting.
- Private Equity Analytics: Two High-Value Use Cases — Portfolio reporting & exit-readiness analytics that create tangible value during the hold.
- Cost Allocation Without Invoice-Level Detail — Practical methods to apportion costs fairly using GL and operational drivers.
- ARR Snowball: Proving Revenue Durability — Visualize inflows/outflows, improve forecasts, and defend higher exit multiples.
- Extending Snowball to Cash & Inventory — Apply the same flow lens to cash (AR ⇄ AP ⇄ Cash) and inventory to improve CCC, turns, and margin.
- Augmenting Financial Analysis with Agentic AI Workflows — Use agentic AI for close acceleration, probabilistic ARR forecasting with prescriptive actions, and causal variance analysis.