ARR Snowball: Proving Revenue Durability
Recurring models, such as SaaS companies, live and die on retention and expansion, not one-time bookings. ARR Snowball decomposes revenue into inflows (new, expansion) and outflows (contraction, churn), yielding clean GRR/NRR and velocity/acceleration trends that expose true revenue durability. Because it’s cohort-aware and definition-consistent, it avoids P&L masking, ties directly to operating levers (pricing, onboarding, CS), and makes forecasts and valuation more defensible—hence its status as the go-to measure of financial soundness in SaaS.
Traditional P&L is great at telling you what happened. ARR Snowball shows how revenue flows—what’s coming in (new logos, expansion) and what’s leaking out (contraction, churn)—so you can see the net build, velocity, and acceleration of growth over time. That makes durability visible, which is exactly what investors pay for.
Why Snowball beats a P&L
A P&L aggregates; Snowball decomposes. By separating inflows and outflows, you expose the levers that actually move valuation:
- Retention and expansion, not just totals. Snowball isolates GRR/NRR, showing whether growth is compounding from the base or masked by constant new-logo replacement.
- Early risk detection. Month-over-month velocity and acceleration reveal when growth is slowing even if the top line still looks fine. Cohorts (by vintage, product, or segment) make where it’s slowing obvious.
- Operational linkage. Because the flows are explicit, you can tie movements to pricing, onboarding, success plays, and renewal hygiene—and measure the effect the very next month.
- Efficiency & LTV. Combine flow with cost-to-serve to monitor LTV, payback, and a simple durability gauge:
Efficiency = inflow ÷ (inflow + outflow). A rising efficiency trend almost always precedes multiple expansion.
Revenue Flow
Traditional ARR Snowball analysis focuses on a waterfall chart which shows the net change. A better way to visualize the revenue flow is in a Sankey diagram as outlined below.
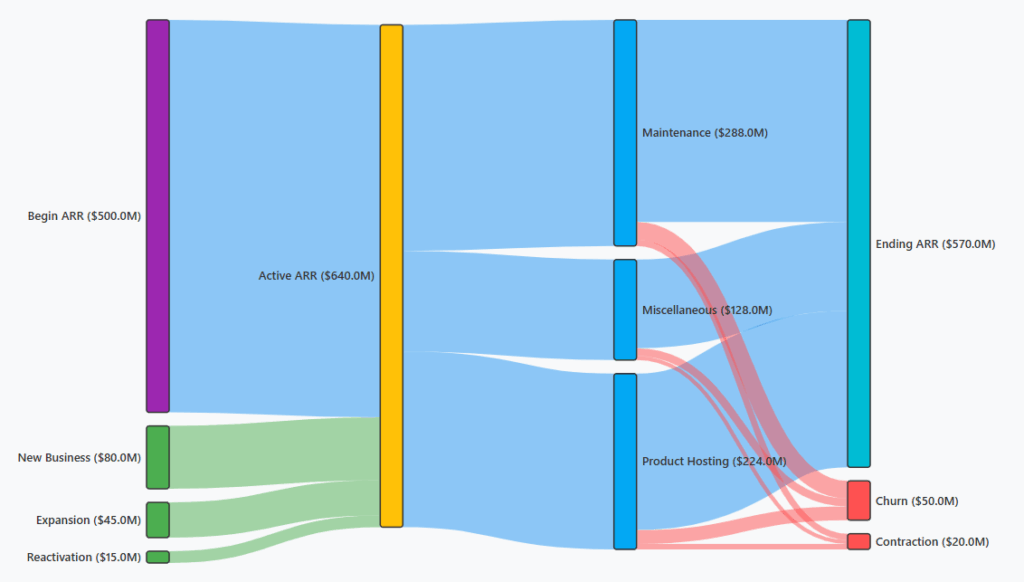
A Sankey shows where it came from and where it went—which is what operating and diligence teams need. Using a data cube behind the chart allows deeper analysis by isolating cohorts and breaking down flow through different metrics.
- Provenance → routing → outcome. Starting ARR splits into new, expansion, contraction, and churn streams; link thickness encodes magnitude so leakage is unmistakable.
- One view, many dimensions. You can branch by cohort, product, or segment without creating six separate charts. Colors communicate direction (inflow vs. outflow) instantly.
- Faster pattern finding. Thick outflows from a specific cohort or product highlight where to intervene; thick expansion streams identify “expansion heroes” worth doubling down on.
- Still keep a mini waterfall. A slim row of monthly bars is perfect for net build and velocity; the Sankey carries the richer “how and where” story.
Using this chart as a starting point, an analyst can quickly visualize and drill into problem spots such as churn. Expanding the chart over multiple time periods can show trends and patterns more effectively. The chart also serves as a launchpad for forecasting and planning.
Operating to value
ARR Snowball turns “are we growing?” into “what’s compounding, what’s leaking, and what do we do next?” By visualizing inflows vs. outflows and the net build each month, you get an early-warning system (velocity/acceleration), a shared language with Finance (GRR/NRR), and a single place to assign owners and budget to the highest-yield levers. The outcome is fewer surprises, faster course-corrections, and a consistent story you can defend to the board—and eventually to buyers.
Incorporating the Snowball into monthly planning helps keep management focused on the overall goals instead of their own silos. Here is a monthly agenda that is supported by the accompanying metrics playbook:
- Scorecard: net ARR build, velocity/acceleration, variance to plan.
- Flow diagnostics: top inflow/outflow drivers, cohort hotspots.
- Actions: 2–3 interventions with owners/dates; confirm expected impact.
- Capital allocation: shift dollars/CS capacity where compounding is strongest.
Sample Operating Metrics and Actions
Every organization is different and would have a different mix of metrics to use for monitoring ARR. Here are some common metrics and the resulting actions when the metric is off track:
| Metric (formula) | What it signals | Operator decisions & plays |
|---|---|---|
Net ARR Build (Ending ARR − Prior Ending ARR) |
Overall compounding pace vs. plan | If down: isolate inflow vs. outflow drivers; assign owners; set 30-day fixes. |
Velocity (Δ Net Build MoM) & Acceleration (Δ Velocity MoM) |
Early inflection in growth | 2+ months negative → review pricing/packaging, onboarding, and save-desk plays; tighten forecast. |
GRR ((Base − Outflow on base) ÷ Base) |
Renewal hygiene & product-market fit | If < guardrail (e.g., 90–95%): run churn-reason analysis; strengthen 90/60/30 renewal motions; close value gaps. |
NRR ((Base − Outflow + Expansion) ÷ Base) |
Expansion health & whitespace capture | If flat but GRR OK: launch upsell/cross-sell campaigns; add success plans; adjust bundles/tiers. |
Inflow/Outflow Mix & Efficiency (Inflow ÷ (Inflow + Outflow)) |
Durability of growth | Falling efficiency → prioritize save/expand over net-new; rising → increase growth spend in high-yield segments. |
| Expansion Mix % (upsell vs. cross-sell) | Which motion drives NRR | Weak cross-sell → enable multi-product plays; rebundle add-ons; revise price fences. |
| Cohort Health & Hazard (by vintage/product/segment) | Where risk or opportunity concentrates | Red cohorts → assign owner + play (onboarding overhaul, success plan, price/term reset); track monthly impact. |
| Onboarding Health (time-to-value, activation %) | Predictor of future churn | If TTV slips/activation low → add implementation hours; simplify first-value path; pause deep discounts. |
| Usage Leading Indicators (seats, feature adoption, logins) | Renewal intent proxy | Dips inside the 90-day window → trigger CS outreach, in-app nudges, exec sponsor calls. |
| Renewal Ladder (30/60/90 pipeline) | Capacity & focus for CS/deal-desk | Allocate senior reps to high-ARR/at-risk logos; pre-approve save offers; escalate blockers early. |
| Pricing & Discount Leakage (seen as contraction) | Margin & positioning problems | Tighten discount bands; adjust price fences; rebundle to defend ACV. |
| Concentration Risk (Top-10 % of ARR) | Resilience & diligence risk | If rising → diversify pipeline; accelerate expansion in under-penetrated segments; scenario-test downside. |
| LTV & Payback (with cost-to-serve) | Where to invest next | Fund segments with superior LTV:CAC and fast payback; sunset low-yield motions; revisit support model. |
Incorporating forecast into the flow
The previous breakdown focused on a historical view, but the same process can be used for future planning and forecasting. The ARR Snowball visualizes your pipeline, renewals, and expansion opportunities into an ARR-based sales forecast: each deal is mapped to a go-live month and ramp, renewals carry probability and expected expansion/contraction, and the result is a forward ARR curve that Sales uses to set targets and coverage, plan capacity/territories, and make in-quarter course corrections. It keeps bookings honest (no double counting before go-live) and turns the forecast into an operating tool—updated monthly as usage and deal health change. Again, different companies would have different metrics to track, but here are a few that could be used:
- Renewal ladder: 30/60/90/180-day schedule with logo/ARR, term, and owner.
- Health & probability: assign a renewal probability by segment/cohort using leading indicators (usage, activation, support load, executive sponsor, discount level).
- Expansion/contraction baselines: segment-level rates (e.g., +x% upsell, −y% contraction) back-tested on the last 12–24 months.
- New business feed: stage-weighted pipeline → ARR start date and ramp curve (e.g., 50% of ACV recognized in month 1, then full run-rate).
- Pricing & terms: planned changes (uplifts, bundles, annual vs. monthly) applied to the right cohorts to prevent double counting.
Conclusion: durable, repeatable growth you can prove
ARR Snowball turns the data you already have into a living operating view—showing where revenue is compounding, where it’s leaking, and what to do next. By separating inflows and outflows and tracking velocity, acceleration, GRR/NRR, and cohort health, you move from retrospective reporting to a monthly cadence of targeted action that compounds value over the hold period.
What you gain, consistently:
- Clarity on revenue quality. A clean record of GRR/NRR, inflow/outflow mix, and cohort durability—so you’re managing compounding ARR, not masking churn.
- A forecast you can run. Renewal ladders, probability-weighted expansions/contractions, and simple scenarios produce a forward ARR curve Sales and Finance both trust.
- Attribution and repeatability. Before/after evidence ties pricing, onboarding, and CS plays to retention and expansion, making wins repeatable.
- Risk transparency. Concentration, contraction pockets, and churn lineage are quantified—with mitigations owned and in motion.
- Valuation logic. Stronger NRR bands, stable cohorts, and steady net build create a defensible bridge from operating metrics to premium multiples.
Bottom line: Snowball gives you truth about the past and signal for the future—then turns that signal into accountable next steps. Use it as your monthly heartbeat to operate to value and keep the revenue story you’ll tell at exit writing itself.
About K3 Group — Data Analytics
At K3 Group, we turn fragmented operational data into finance-grade analytics your leaders can run the business on every day. We build governed Finance Hubs and resilient pipelines (GL, billing, CRM, product usage, support, web) on platforms like Microsoft Fabric, Snowflake, and Databricks, with clear lineage, controls, and daily refresh. Our solutions include ARR Snowball & cohort retention, LTV/CAC & payback modeling, cost allocation when invoice detail is limited, portfolio and exit-readiness packs for PE, and board-ready reporting in Power BI/Tableau. We connect to the systems you already use (ERP/CPQ/billing/CRM) and operationalize a monthly cadence that ties metrics to owners and actions—so insights translate into durable, repeatable growth.
Explore More on Data & Analytics
- Resilient Data Pipelines for Finance — How to build governed, reliable pipelines (GL, billing, CRM) with controls for daily reporting.
- Private Equity Analytics: Two High-Value Use Cases — Portfolio reporting & exit-readiness analytics that create tangible value during the hold.
- Cost Allocation Without Invoice-Level Detail — Practical methods to apportion costs fairly using GL and operational drivers.
- ARR Snowball: Proving Revenue Durability — Visualize inflows/outflows, improve forecasts, and defend higher exit multiples.
- Extending Snowball to Cash & Inventory — Apply the same flow lens to cash (AR ⇄ AP ⇄ Cash) and inventory to improve CCC, turns, and margin.
- Augmenting Financial Analysis with Agentic AI Workflows — Use agentic AI for close acceleration, probabilistic ARR forecasting with prescriptive actions, and causal variance analysis.